Introducing the Palette Package, Part I
Choosing a set of colors that look good together can be quite a challenge. The task comes up in a variety of different contexts including: website design, print design, cartography, and as we will discuss here, making diagrams. The problem comes down to a balancing act between two issues; first is that the chosen set of colors is aesthetically pleasing, and second is that there is enough contrast between them.
The easiest approach is to borrow a set of colors from someone who has already put in the time and effort to create it. The Palette package "Data.Colour.Palette.ColorSet" provides access to a few different predefined color sets including the ones in d3 and the package "Data.Colour.Palette.BrewerSet" contains a large variety of color schemes created by Cynthia Brewer for use in map making see colorbrewer 2.0.
Let's start out by building some tools in Diagrams, the Haskell drawing framework. We will use the golden ration to give us some pleasing proportions.
> gr = (1 + sqrt 5) / 2The function bar takes a list of colors which we define here as [Colour Double] (we often use the type synonym [Kolor]). We set the length of the color bar to the golden ratio and the height to 1.
> bar cs = hcat [square gr # scaleX s # fc k # lwG 0 | k <- cs] # centerXY
>   where s = gr / (fromIntegral (length cs))
We can use bar to view the color sets in Palette. Let's make a few color bars. We will use functions provided in Palette to make the color lists and then use bar to make the diagrams. The function d3Colors1 takes an Int between 0 and 9 and returns a color from the set.
> d3 = [d3Colors1 n | n <- [0..9]]
> example = bar d3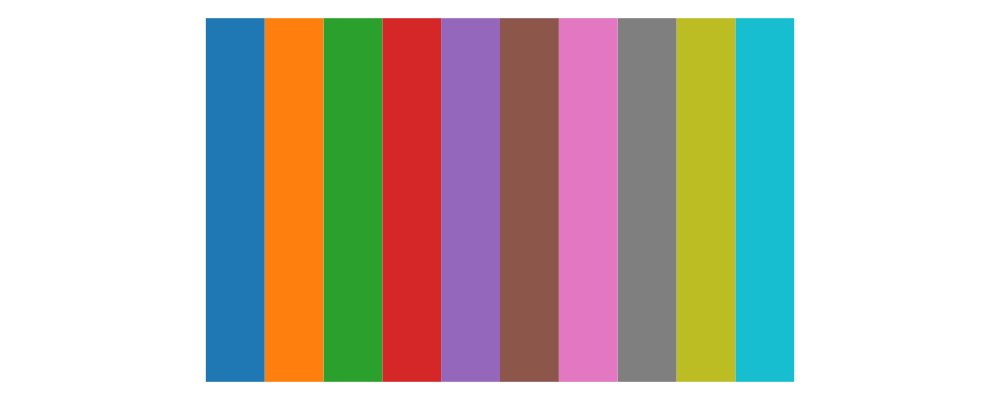
The function we use to access schemes from Data.Colour.Palette.Brewerset is brewerSet. It takes two arguments: the category of the set ColorCat (see the haddocks documentation for a list of categories), and an integer representing how many colors in the set. The sets are divided up into 3 categories primarily for showing different types of data on a map: sequential, diverging and qualitative. But they are useful for making diagrams as well.
> gb = bar $ brewerSet GnBu 9    -- green/blue, sequential multihue
> po = bar $ brewerSet PuOr 11   -- purple/orange, diverging
> bs = bar $ brewerSet Paired 11 -- qualitative
> example = hcat' (with & sep .~ 0.5) [gb, po, bs]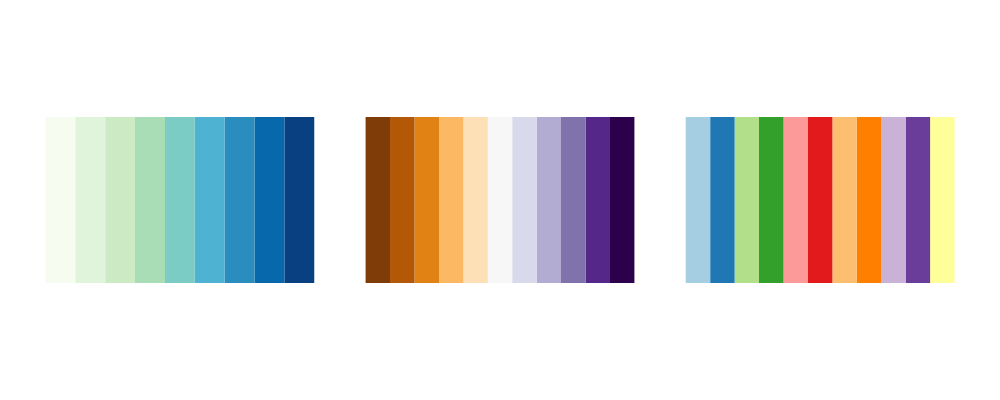
Some of the color sets provided in ColorSet occur with 2 or 4 brightness levels. data Brightness = Darkest | Dark | Light | Lightest with Darkest == Dark and similarly for Light when using a two set variant. The grid function is useful for visualizing these.
grid takes a nested list of colors [[Kolor]] and returns a grid of vertically stacked bars.
> grid cs = centerXY $ vcat [bar c # scaleY s | c <- cs]
>   where s = 1 / (fromIntegral (length cs))
>
> d3Pairs = [[d3Colors2  Dark  n | n <- [0..9]], [d3Colors2 Light n | n <- [0..9]]]
> g2 = grid d3Pairs
>
> d3Quads = [[d3Colors4 b n | n <- [0..9]] | b <- [Darkest, Dark, Light, Lightest]]
> g4 = grid d3Quads
> example = hcat' (with & sep .~ 0.5) [g2, g4]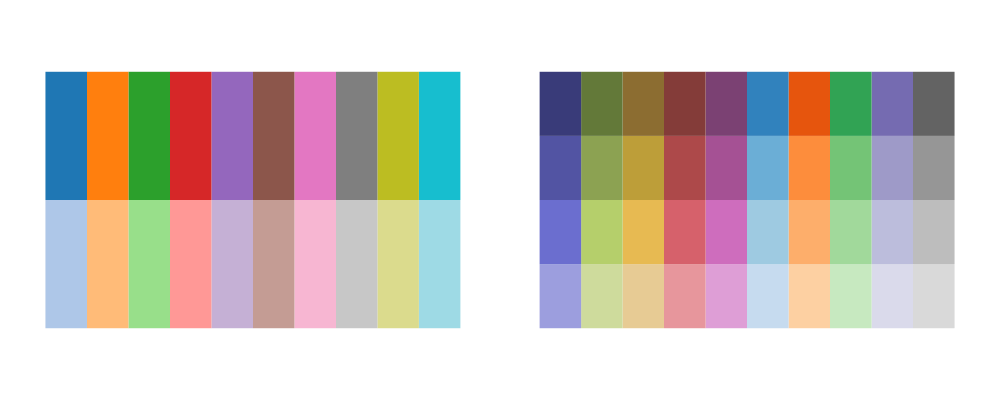
The are over 300 colors that W3C recommends that every browser support. These are usually list in alphabetical order, which needless to say does not separate similar colors well. Palette provides the function webColors which takes an integer n returns the n th color in a list which has first been sorted by hue and then traversed by skipping every 61 elements. This cycles through a good amount of colors before repeating similar hues. The variant infiniteWebColors recycles this list. When using these colors it's a good idea to pick some random starting point and increment the color number by 1 every time a new color is required.
> web = [[webColors (19 * j + i) | i <- [0..8]] | j <- [0..8]]
> w1 = grid web
>
> web2 = [[webColors (19 * j + i) | i <- [0..19]] | j <- [0..14]]
> w2 = grid web2
> example = hcat' (with & sep .~ 0.5) [w1, w2]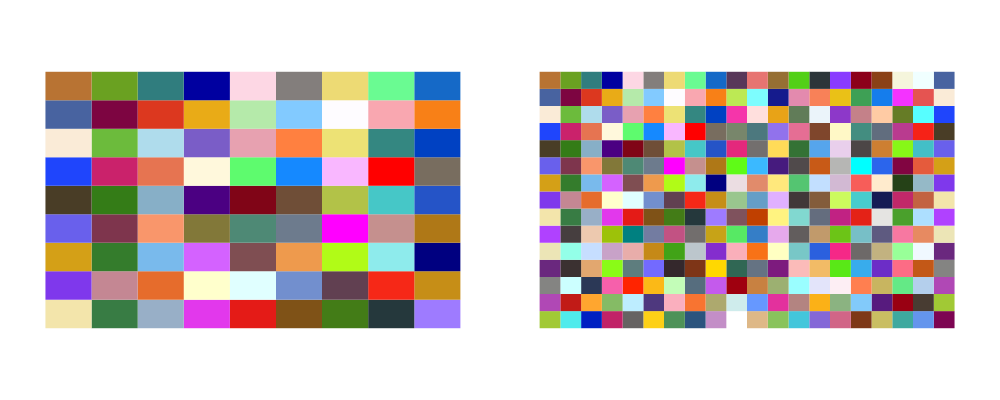
If none of the above color schemes suit your purposes or if you just want to create your own - use the functions in Data.Colour.Palette.Harmony. The module provides some basic functions for adjusting colors plus a programmatic interface to tools like Adobe Kuler and Color Scheme Designer. We'll finish Part 1 of this post by examining some of the functions provided to tweak a color: shade, tone and tint. These three functions mix a given color with black, gray, and white respectively. So if for example we wanted a darker version of the d3 scheme, we can apply a shade.
Or we can add some gray to the brewer set GnBu from above.
> s = bar $ map (shade 0.75) d3
> t = bar $ map (tone 0.65) (brewerSet GnBu 9)
> example = hcat' (with & sep .~ 0.5) [s, t]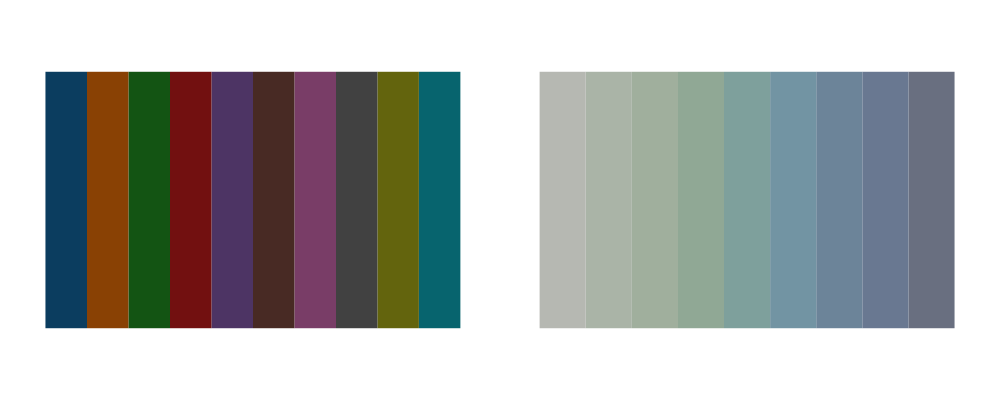
In part II we will talk just a bit about color theory and explain more of the functions in Harmony.