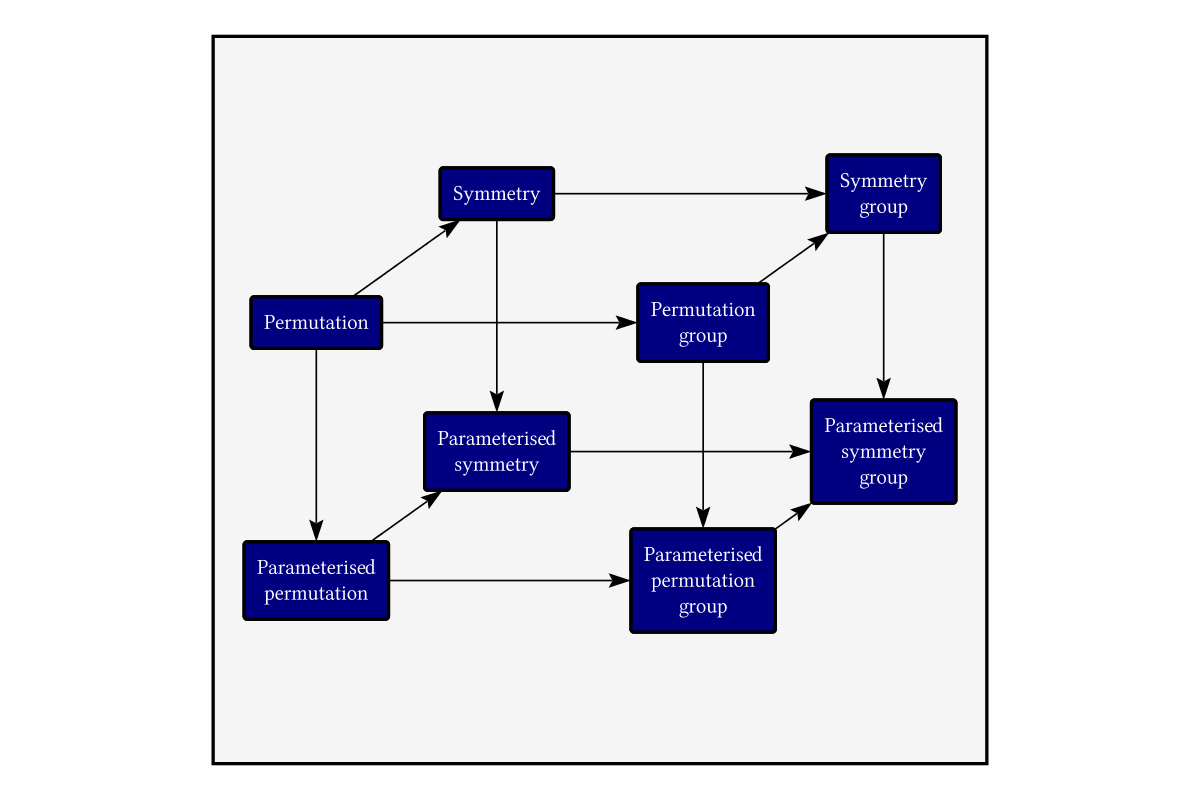
Basic diagram with text, boxes and arrows.
import Diagrams.Backend.SVG.CmdLineimport Data.List.Split
import Data.Maybe
import Diagrams.BoundingBox
import Diagrams.Prelude
import Graphics.SVGFonts
import Graphics.SVGFonts.ReadFont (PreparedFont)The diagram is the boxes (the “cube”) and the lines between the boxes.
example = do
  font <- lin2
  let c = sCube font
  return $ pad 1.1 . centerXY $ c <> drawLines c <> square 30
                                # fc whitesmoke
                                # scaleY 0.94
                                # translateX 11
                                # translateY (-3)
A “box” is a diagram (the “innards”) surrounded by a rounded rectangle. First the innards are padded by a fixed amount, then we compute its height and width – that’s the size of the surrounding rectangle.
box innards padding =
    let padded =                  strutY padding
                                       ===
             (strutX padding ||| centerXY innards ||| strutX padding)
                                       ===
                                  strutY padding
        height = diameter (r2 (0,1)) padded
        width  = diameter (r2 (1,0)) padded
    in centerXY innards <> roundedRect width height 0.1
A single string of text.
text’ font s h = (set_envelope . fit_height h . svgText def { textFont = font } $ s) # lw none # fc white Several lines of text stacked vertically.
centredText font ls n = vcat' (with & catMethod .~ Distrib & sep .~ n)
                     (map (\l -> centerX (text' font l n)) ls)
centredText' font s = centredText font (splitOn "\n" s)
Diagram-specific parameters, including the positioning vectors.
padAmount = 0.5

down = r2 (0, -10)

upright = r2 (7, 5)

right = r2 (15, 0)
A box with some interior text and a name.
mybox font s n = (box (centredText' font s 1) padAmount) # named nThe cube is just several boxes superimposed, positioned by adding together some positioning vectors.
sCube :: PreparedFont Double -> Diagram B
sCube font = fc navy $ mconcat
  [ mybox font "Permutation" "perm"
  , mybox font "Permutation\ngroup" "permgroup"                     # translate right
  , mybox font "Symmetry" "sym"                                     # translate upright
  , mybox font "Parameterised\npermutation" "paramperm"             # translate down
  , mybox font "Parameterised\npermutation\ngroup" "parampermgroup" # translate (right ^+^ down)
  , mybox font "Parameterised\nsymmetry" "paramsym"                 # translate (down ^+^ upright)
  , mybox font "Symmetry\ngroup" "symgroup"                         # translate (upright ^+^ right)
  , mybox font "Parameterised\nsymmetry\ngroup" "paramsymgroup"     # translate (down ^+^ right ^+^ upright)
               ]
For each pair (a,b) of names, draw an arrow from diagram “a” to diagram “b”.
drawLines :: Diagram B -> Diagram B
drawLines cube = foldr (.) id (map (uncurry
                       (connectOutside' (with
                       & headLength .~ small
                       & shaftStyle %~ lw thin))) pairs) cube
  where pairs = [ ("perm","permgroup")
                , ("perm","sym")
                , ("perm","paramperm")
                , ("paramperm","paramsym")
                , ("sym","symgroup")
                , ("paramsym","paramsymgroup")
                , ("permgroup","symgroup")
                , ("paramperm","parampermgroup")
                , ("symgroup","paramsymgroup")
                , ("sym","paramsym")
                , ("permgroup","parampermgroup")
                , ("parampermgroup","paramsymgroup")
                ]
main = mainWith (example :: Diagram B)